

.png)


By Larry Ouyang
Dashboards have been used as a major tool in tracking operational performance with Key Performance Indicators (KPIs) displayed and highlighted on them. With the integration of visual tools, such as Tableau, to the network optimization engine, additional improvements have been incorporated into dashboard development. These improvements visually improve the ease and efficiency of network modeling. Some key benefits include using a dashboard in network optimization are:
Dashboard design in network optimization:
Each business’ operating network is different. However, there are common factors to consider regardless of industrial verticals in network optimization. Major considerations include:
Key performance measurements to be considered are Capacity Utilization, Lead Time, Transit Time, Volume, Cost and Potential Risk associated.
A network dashboard can blend all the major considerations and KPIs in a single display. CGN’s work below demonstrates methodologies to design within dashboards and some of the key capabilities dashboards can deliver (Real business case developed in Tableau for illustration purpose only).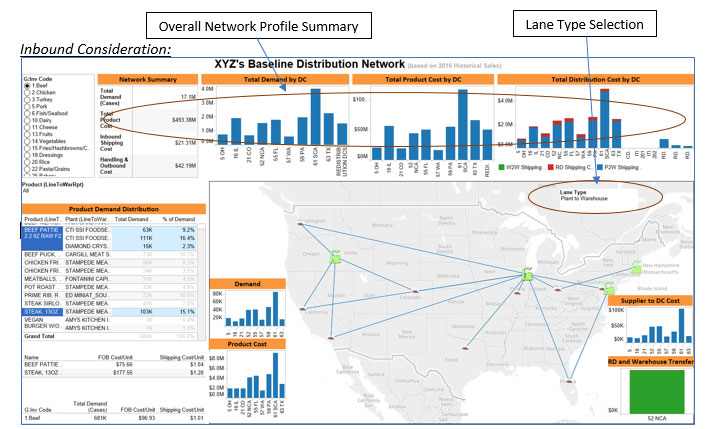
Fig 1. Select Supplier(Plant) to Plant(Warehouse)
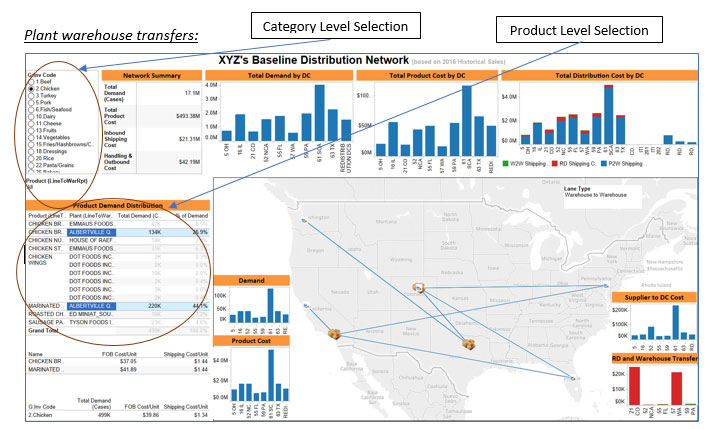
Fig 2. Select Plant(Warehouse) to Plant(Warehouse) Transfer
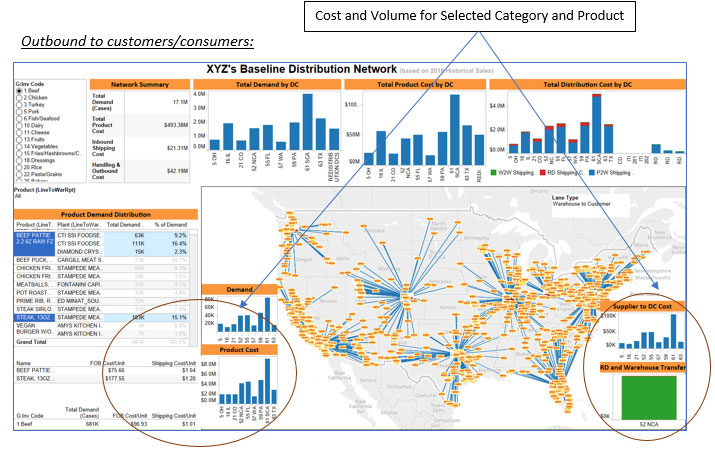
Fig 3. Select Warehouse to Customer
By navigating category/product, supplier and lane type, both the network optimization engineer and business users can utilize an overall business view, as well as a detailed comparison on cost and volume on specific lanes/product.
Key success factors in Dashboard development for network optimization:
1. Management buy-in and cross functional team support.
As the dashboard tool has key performance measurements at both a summary and a detailed level, it really connects all levels within the organization. It also connects cross functions within the company. Finance, marketing/sales, supply chain operations can all utilize the visual tool to support their daily tactics and longer term strategic decision-making. Ensuring management’s understanding and support will make the tool, as well as development efforts, visible across the entire organization
2. Alignment with company’s performance target, priority focus and cultures
The network dashboard is not only a supply chain modeling tool, but it also represents the priorities companies are focusing on, as well as corporate culture. Functionality of the dashboard is a top focus for success. Dashboard layout, design of performance indicators as well as colors and graphics are equally important.
3. Dos:
a. Present the data and ensure data has been formulated accurately
b. Emphasize substance instead of methodology or the graphic design
c. Reveal the data at several levels: from summary to detail category and product
d. Use accurate comparisons with consistent graphic sizes
e. Provide the greatest amount of data with the least amount of ink in the smallest space
4. Don’ts:
a. Let the information lie
b. Get graphically complicated with design variation
c. Forget to label the data right on the graphic or provide actual numbers
d. Distort the visual representation of the data
CGN is a pioneer in leveraging and utilizing dashboard tools in network optimization practices and has subject matter experience in helping clients tailor their needs in network scenarios’ development and verification. We formulate clients’ supply chain network into this visual tool and support clients to potentially explore the improvement opportunities on their own. CGN also assists dashboard refreshment on a regular basis, based upon the nature of the business or per request, to support clients focused on operating in the most efficient ways, to win in the dynamic marketplace.
25eb.png?width=203&name=CGN_Tagline1%20(1).png "CGN_Tagline1 (1)")